

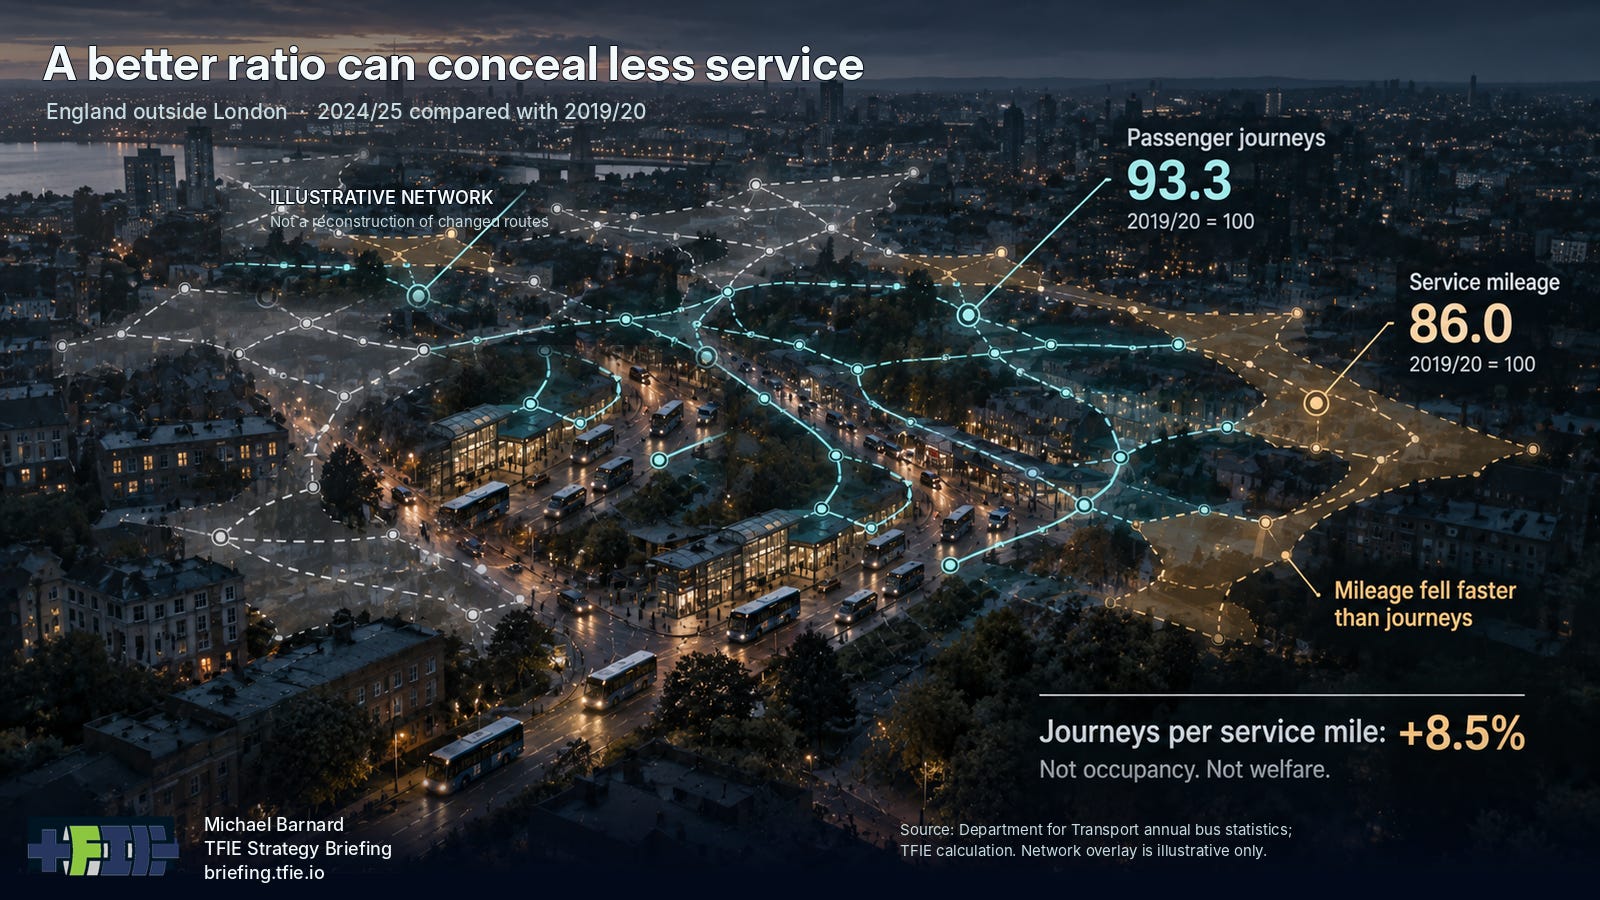
England outside London recorded approximately 8.5% more passenger journeys per bus service mile in 2024/25 than it did before COVID-19. That sounds encouraging, especially for an industry under continuing pressure to contain costs and attract passengers. Yet the Department for Transport’s revised annual statistics tell a more complicated story. Passenger journeys declined from approximately 1.984 billion in 2019/20 to 1.851 billion in 2024/25, recovering to 93.3% of their earlier level. Bus service mileage recovered to only 86.0%. Divide those two recovery indexes and journeys per service mile increased by approximately 8.5%, a calculation made by TFIE Strategy from the published statistics rather than an official Department for Transport productivity indicator. The calculation is correct, but it does not establish that passengers received a better service or that the network became more useful. These are comparisons with the pre-pandemic baseline, not claims that mileage declined every subsequent year. Indeed, service mileage outside London increased by 3% between 2023/24 and 2024/25, while remaining substantially below its 2019/20 level.
The distinction begins with what is being counted. A passenger journey in the Department for Transport statistics is a boarding, so someone changing buses on the way to work generally counts as two journeys. Service mileage records the distance travelled by buses providing local services. Dividing boardings by service miles tells us how many boardings the system generates for each mile operated. It does not tell us how far those passengers travelled, how many passenger-kilometres were delivered, how many people could reach a destination within a reasonable time, or whether the network retained the connections they depended upon. Even average occupancy requires different information: passenger-kilometres divided by comparable vehicle-kilometres. When service mileage contracts faster than recorded boardings, journeys per mile rise mathematically, regardless of whether the remaining network is better designed.
Consider a hypothetical evening-shift worker living on the edge of a British city. A relatively frequent bus connects their neighbourhood to a major interchange, where a second service provides access to a hospital employing thousands of people. The first bus runs every fifteen minutes, but the second carries relatively few passengers outside peak periods. Its operator withdraws the late-evening journeys because fare revenue does not cover the cost of providing them. That may be a commercially sensible decision, with real savings in driver hours, energy and vehicle wear. It also means the worker can reach the hospital but cannot reliably get home after a late shift. The busy first route remains available, and the overall productivity of the surviving services may improve, but the worker’s complete journey no longer exists. The statistics record the mileage that disappeared and the boardings that remain. They do not directly record the employment opportunity that has become inaccessible.
There is nothing inherently inefficient about withdrawing poorly used mileage. The historical evidence on Britain’s bus reforms shows that competition placed substantial pressure on operating costs following deregulation outside London in 1986. London also achieved substantial operating-cost reductions through competitive tendering while retaining public control of its passenger network. Staffing, maintenance, scheduling, procurement and vehicle utilization remain legitimate areas for improvement, and requiring operators to preserve every loss-making journey regardless of its value would be an expensive way to run public transport. Operators also face constraints outside their control. Congestion slows buses, reduces reliability and increases the number of vehicles and drivers needed to maintain a timetable. Bus priority, road allocation and some of the infrastructure that determines operating efficiency are matters for highway authorities and elected governments. An operator cannot reasonably be expected to finance every socially valuable connection from its commercial revenue, especially when other institutions control important parts of the cost equation.
Those constraints are central to the network problem rather than an argument against commercial operators. A connecting route helps determine whether another route can deliver useful journeys, whether a household can manage without a second car, and whether somebody can accept work involving early or late hours. A service may have value because it is available when needed, even if particular departures are lightly used. That value is not unlimited, and a different timetable, better connection, bus-priority intervention or alternative service arrangement might provide it more economically. Establishing whether a reduction produces a net benefit requires comparing the operating savings with the change in passenger access and the cost of plausible alternatives. The operator’s financial result is an important input to that decision, while the metropolitan authority must consider consequences that extend beyond the services and revenues of any individual company.
Britain’s experience provides considerable reason to take that wider calculation seriously. The National Audit Office’s June 2025 assessment of local bus services in England concluded that commercial viability had weakened and passengers had experienced service reductions despite substantial government intervention. It also identified congestion, inconsistent funding and limitations in local transport authority capacity as significant obstacles. The Department for Transport’s 2024/25 statistics recorded approximately 740 million local bus service miles outside London, including 578 million commercially operated miles, 125 million supported miles and 33 million classified as publicly controlled. Commercial mileage was only about 78% of its pre-pandemic level, although that figure requires care: Greater Manchester’s transition to franchising moved some mileage into the publicly controlled category without necessarily removing the corresponding services. Total service mileage is therefore the more useful measure of actual contraction. The growing importance of public support also shows that decisions about marginal service provision already involve both commercial operators and public authorities.
COVID-19 made the relationship between service supply and passenger demand particularly visible. When demand collapsed, emergency public support kept many services operating that could not have survived on fares alone. As demand recovered, operators and authorities faced decisions about which services to retain, restore or redesign. A plausible danger is a reinforcing cycle in which lower patronage leads to reduced frequency or coverage, the reduced network becomes less attractive, and further passengers abandon it. That mechanism is economically credible, and the National Audit Office has identified related risks, but the national figures do not establish how much of the observed decline it caused. Working from home, population changes, fare policy, local economic conditions and changing travel patterns also affected demand. Preserving service does not guarantee that passengers will return, just as withdrawing service does not automatically explain every lost journey. The relevant question is whether the decisions preserve enough network usefulness to support future demand rather than responding only to the revenue already visible.
Other metropolitan systems demonstrate that service provision and passenger recovery can take quite different paths. London retained broadly stable bus mileage through the post-pandemic period despite passenger journeys recovering to only about 87% of their 2019/20 level by 2024/25. Dublin followed a different trajectory: National Transport Authority statistics show Dublin city-bus patronage reaching approximately 117.5% of its 2019 level in 2024, while the BusConnects network redesign was providing around 35% more scheduled service-kilometres in the introduced network than the old network plan. Those Dublin percentages have different baselines and coverage, so they cannot be divided into a comparable productivity statistic. Neither city’s trajectory proves the superiority of a particular governance arrangement. Population, funding, fares, transport alternatives and post-pandemic travel patterns differ substantially. What the comparisons establish is that passenger recovery and the amount of service an authority chooses to sustain are separate decisions and outcomes.
The question of which services deserve protection has also entered English legislation. Section 14 of the Bus Services Act 2025, which came into force in April 2026, requires local transport authorities using enhanced partnership arrangements to identify socially necessary local services. These include services whose withdrawal would materially harm access to essential goods, employment opportunities or social activities. Enhanced partnership schemes must establish procedures for proposed withdrawals or significant changes to identified services, including consideration of alternative arrangements. This does not guarantee that every service will be retained, nor does it supply additional funding automatically. It does recognize that the consequences of losing a service cannot always be assessed from its commercial profitability alone. Scotland and Ireland have different legislative arrangements, but the underlying problem of distinguishing route economics from passenger-network value is shared.
More service mileage, however, is no guarantee of a useful network. Running nearly empty buses along overlapping routes can consume money that might deliver greater value through better frequency elsewhere, longer evening operating hours or coordinated transfers. A network redesign may legitimately withdraw some services while improving access for more passengers, particularly when land use, employment patterns and other transport options have changed. Conversely, concentrating nearly all service on the busiest corridors can produce attractive productivity statistics while leaving essential cross-city and peripheral journeys impractical. Determining which outcome is preferable requires a metropolitan view of origins, destinations, journey times, service spans and the people affected. It also requires an explicit decision about how much public money should support access that commercial demand cannot sustain on its own.
For a council or transport authority considering a proposed service withdrawal, the practical test is straightforward even if the underlying analysis is not. What is the net operating saving, including any change in public support? Which employment, healthcare, education and other destinations become harder to reach, at what times of day, and for which residents? Would a different timetable, a protected connection, a smaller amount of strategically placed service or improved bus priority preserve much of the value at lower cost? The relevant authority may not have the legal power to prevent a commercial withdrawal, and even where it has that power it may lack the budget to fund a replacement. Those limits should be explicit in the decision rather than hidden behind a favourable productivity statistic. The objective is to identify the best achievable network outcome within the actual powers, resources and constraints of the institutions involved.
That points toward a more useful way of assessing bus performance. Operator cost per vehicle-kilometre remains essential, alongside the amount of scheduled service actually delivered, its reliability, and the passengers and passenger-kilometres carried. A second account should examine what residents can use the network to accomplish. How many homes can reach major employment areas, hospitals or colleges within a reasonable door-to-door journey time? Are those journeys still available in the evening or on weekends, including a practical return trip? How much waiting, transferring and fare expense do they require? These measures need to be evaluated for different neighbourhoods and travel needs rather than collapsed into a single apparently precise score. The evening worker in the earlier example should be visible in that account even when the number of bus journeys they make has fallen to zero.
Passenger surveys offer another important perspective, with an instructive limitation. Transport Focus’s Your Bus Journey survey provides independent feedback on more than 50,000 journeys in its 2025 results, including punctuality, value for money and the experience of travelling. That is valuable information about services people actually use. It cannot, by itself, establish the unmet demand among people whose journeys have become impractical or who no longer attempt to travel. Authorities need both kinds of evidence: the quality of completed journeys and the accessibility of opportunities for residents whether or not they currently appear in boarding statistics. Otherwise, a network can shed its least convenient journeys and some of its least well-served passengers without those losses being adequately represented in its performance reporting.
The central issue is ultimately one of responsibility rather than arithmetic. A bus operator can be entirely competent at reducing operating costs, maintaining its vehicles and delivering the services for which it is paid. Those capabilities should be preserved and rewarded. Someone with a metropolitan mandate must also decide which connections, service hours and levels of coverage deserve support, what trade-offs are justified, and whether the system remains useful when individual services change. That institution needs the information, authority and funding to make decisions across operating boundaries, as well as accountability when the results disappoint. The 8.5% increase in journeys per service mile is a valid statistic. Its limitation is that it cannot tell us whether Britain’s bus passengers are better served. To establish that, the unit of analysis must be the passenger network and the complete journeys it makes possible.
The full TFIE Strategy report, The Bus Is Not the System — Metropolitan Transit Governance, examines the evidence across British and Irish metropolitan systems and the practical implications for network design, operating contracts and electrification. TFIE Strategy helps transport authorities, operators and public funders evaluate proposed service changes, network performance and procurement trade-offs against both operating economics and passenger accessibility. Contact Michael Barnard to discuss a live decision or request the report’s supporting Evidence Book.
Second in a five-part series. Next: The Bus Can Move. The Grid Connection Cannot.