

At the beginning of the year, on Redefining Energy’s annual predictions episode, I made a deliberately aggressive call: 20 GW of solar in Africa in 2026. It was not a forecast built from one utility-scale procurement round or one government target. It was a market-structure call. Cheap Chinese modules were looking for destinations. Batteries were getting cheaper. Many African grids remained weak, unreliable or incomplete. Diesel remained expensive. Mines, telecoms, malls, factories, warehouses, farms, clinics, schools and households all had practical reasons to want electricity that did not depend entirely on fuel trucks or grid reliability.
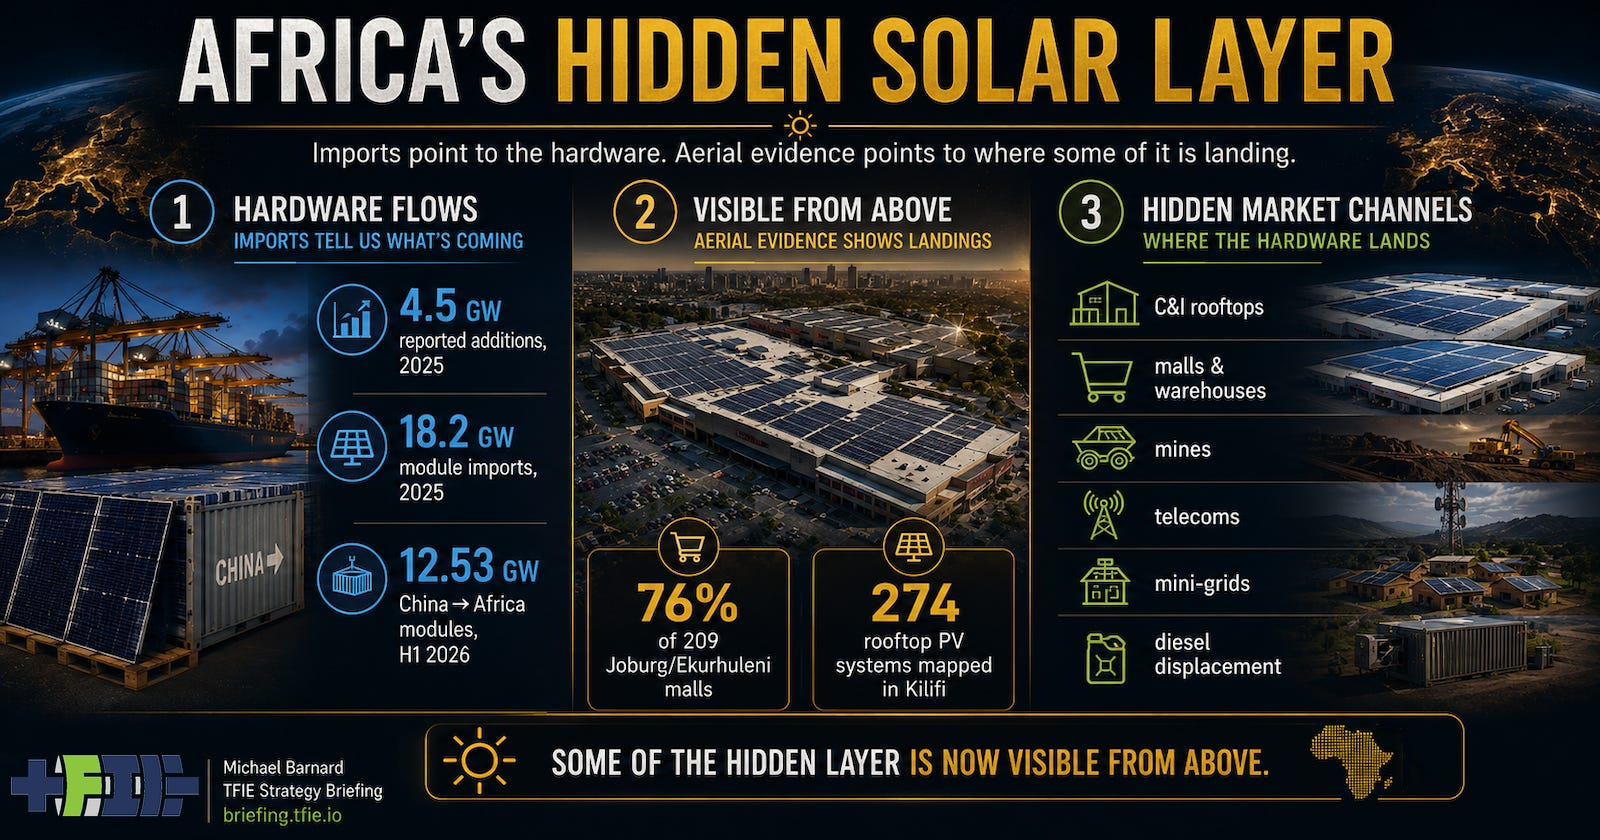
The first pass at that argument was a hardware-flow thesis. In the recent TFIE Strategy Briefing pathway review, I argued that Africa’s solar market was becoming visible first in the wrong dataset. Official capacity additions still looked modest. Hardware flows did not. The Global Solar Council reported about 4.5 GW of African solar additions in 2025, while module imports reached 18.2 GW. By mid-2026, the flow had continued, with InfoLink reporting 12.53 GW of Chinese finished modules shipped to Africa in H1 2026. That did not mean every imported watt was installed, but it did mean that official grid-connected statistics were unlikely to be seeing the full market.
Modules at a port are not operating systems. Some panels are inventory. Some are waiting for inverters, batteries, financing, installers or interconnection. Some are destined for projects that will commission later. Some may be re-exported. The distinction matters because the 20 GW prediction should not be tested by pretending that imports and installations are the same thing. But when imports are running several times ahead of reported additions, the burden shifts. The interesting question is no longer whether there is a gap. The interesting question is where the hardware is going.
Aerial and satellite evidence is starting to answer that question, not completely but usefully. It does not yet show Africa repeating Pakistan’s pattern of dense residential rooftop saturation across entire urban neighbourhoods. Pakistan remains the reference class for an import-led, customer-driven solar surge that outran official statistics. The visible African pattern, at least in the strongest public evidence so far, is different. It is more commercial, industrial and institutional. That matters because it fits the Africa thesis better than a simple copy of Pakistan would have.
The clearest public example is South Africa. DataDesk and The Outlier used satellite imagery to review 209 shopping malls in Johannesburg and Ekurhuleni and found rooftop solar on 76% of them. That is a strong signal because malls are exactly where the economics should show up first. They have large flat roofs, daytime load, relatively creditworthy owners, high electricity bills and direct exposure to outages. Solar on a mall roof is not a climate aspiration. It is a procurement decision.
That evidence also aligns with South Africa’s broader behind-the-meter estimates. MyBroadband, drawing on the same mall analysis and National Transmission Company of South Africa data, reported behind-the-meter solar at roughly 9.1 GW in June 2026. That figure is an estimate, not a meter-by-meter registry, but its scale is difficult to ignore. If South Africa alone has multi-gigawatt customer-side solar, then official utility procurement statistics are not sufficient to understand Africa’s solar transition.
Kenya provides a different kind of evidence. The World Resources Institute and partners used AI and Earth Observation methods to map rooftop PV in Kilifi South, identifying 274 existing rooftop solar PV systems in Kilifi town. Kilifi is not a gigawatt-scale market signal by itself. Its importance is methodological. It shows that the distributed solar layer can be measured directly from above, at least partially, rather than inferred only from imports or survey data. That matters for Africa because the missing layer is likely to be fragmented across many small and medium systems.
The evidence streams now fit together. Customs data says the hardware is entering African markets at a scale that official additions do not explain. Aerial evidence shows some of that hardware on the roofs of commercial and institutional customers. Official statistics, while still useful, remain structurally late for behind-the-meter, off-grid, mini-grid and fragmented customer-side systems.
This does not close the case. Satellite evidence has its own biases. It is easier to detect panels on malls, factories and warehouses than on small homes. It is easier to see large clean roofs than cluttered urban roofs or rural systems under tree cover. Resolution matters. Image dates matter. A panel visible from above is not automatically an operating system. A system that is not visible from above may still be working. Telecom sites, solar home systems, small farms, clinics, water pumps, mini-grids and informal installations are all easy to miss. Satellite evidence is a filter, not a meter.
But the direction of the evidence is important. The import-data thesis predicted that Africa’s hidden solar layer would not be primarily a neat list of utility projects. It would be commercial and industrial systems, mines, telecoms, mini-grids, rooftops, farms, warehouses and diesel displacement. The photographic evidence now available points in that direction. South African malls and C&I rooftops are not the whole African market, but they are a visible part of the mechanism.
The Pakistan comparison should therefore be used carefully. Pakistan’s boom has been highly visible as rooftop solar spread through residential and commercial neighbourhoods after very large Chinese panel imports. Africa’s visible pattern so far looks less like a household solar carpet and more like a customer-side business response to unreliable or expensive power. In South Africa, the driver was load-shedding and electricity risk. In Nigeria, it is diesel displacement and weak-grid resilience. In Zambia, it is drought stress on a hydro-heavy system. In mining regions, it is power quality and production continuity. Same broad technology. Different economic jobs.
That difference strengthens the earlier pathway review rather than weakening it. If Africa were simply copying Pakistan’s residential rooftop pattern, the analysis would be easier but less interesting. The emerging African pattern is messier. It is also potentially more consequential for power systems, because commercial, industrial and mining loads are large, creditworthy and operationally sensitive. When those customers install solar and batteries, they are not just changing household bills. They are changing the economics of grid demand, diesel consumption, wheeling, distribution revenue and industrial competitiveness.
The next analytical step is not to collect more anecdotes. It is to combine evidence streams. Finished-module imports are the leading hardware signal. Inverter and battery imports are the necessary system cross-checks. Satellite and aerial detection can identify visible customer-side deployment. Utility and transmission estimates can capture behind-the-meter growth where regulators are paying attention. Project commissioning data can separate paper milestones from operating assets. Diesel consumption data, where available, can show whether solar is displacing fuel rather than merely adding capacity on paper.
That is the standard I will use in the next updates to the Africa solar pathway review. The question is not whether 20 GW of official African solar additions will appear in 2026. That still looks unlikely. The question is whether African markets physically absorb something closer to that scale through a combination of utility-scale projects, C&I systems, rooftops, mini-grids, mining power, warehouses and inventory conversion. The hardware flows say that is plausible. The aerial evidence says at least part of the hidden layer is real.
The useful conclusion is measured but sharper than before. The boom is not fully proven by imports, and it is not fully quantified by photos. But the import data and the visible rooftop evidence now point in the same direction. Africa’s solar transition is showing up first where official statistics are weakest: customer-side power, distributed deployment and commercial decisions made outside the old utility-planning frame.
The earlier question was whether the solar boom was missing. The better question now is how much of it is already visible from above, waiting for the statistics to catch up.
For the full professional pathway review, update triggers and project evidence, read the companion analysis at TFIE Strategy Briefing. Also, subscribe.