

At the start of 2026, I predicted that Africa would surprise a lot of observers with solar deployment this year. That was not based on one national policy announcement or one utility-scale project pipeline. It was based on a set of reinforcing conditions that were beginning to look like a system.
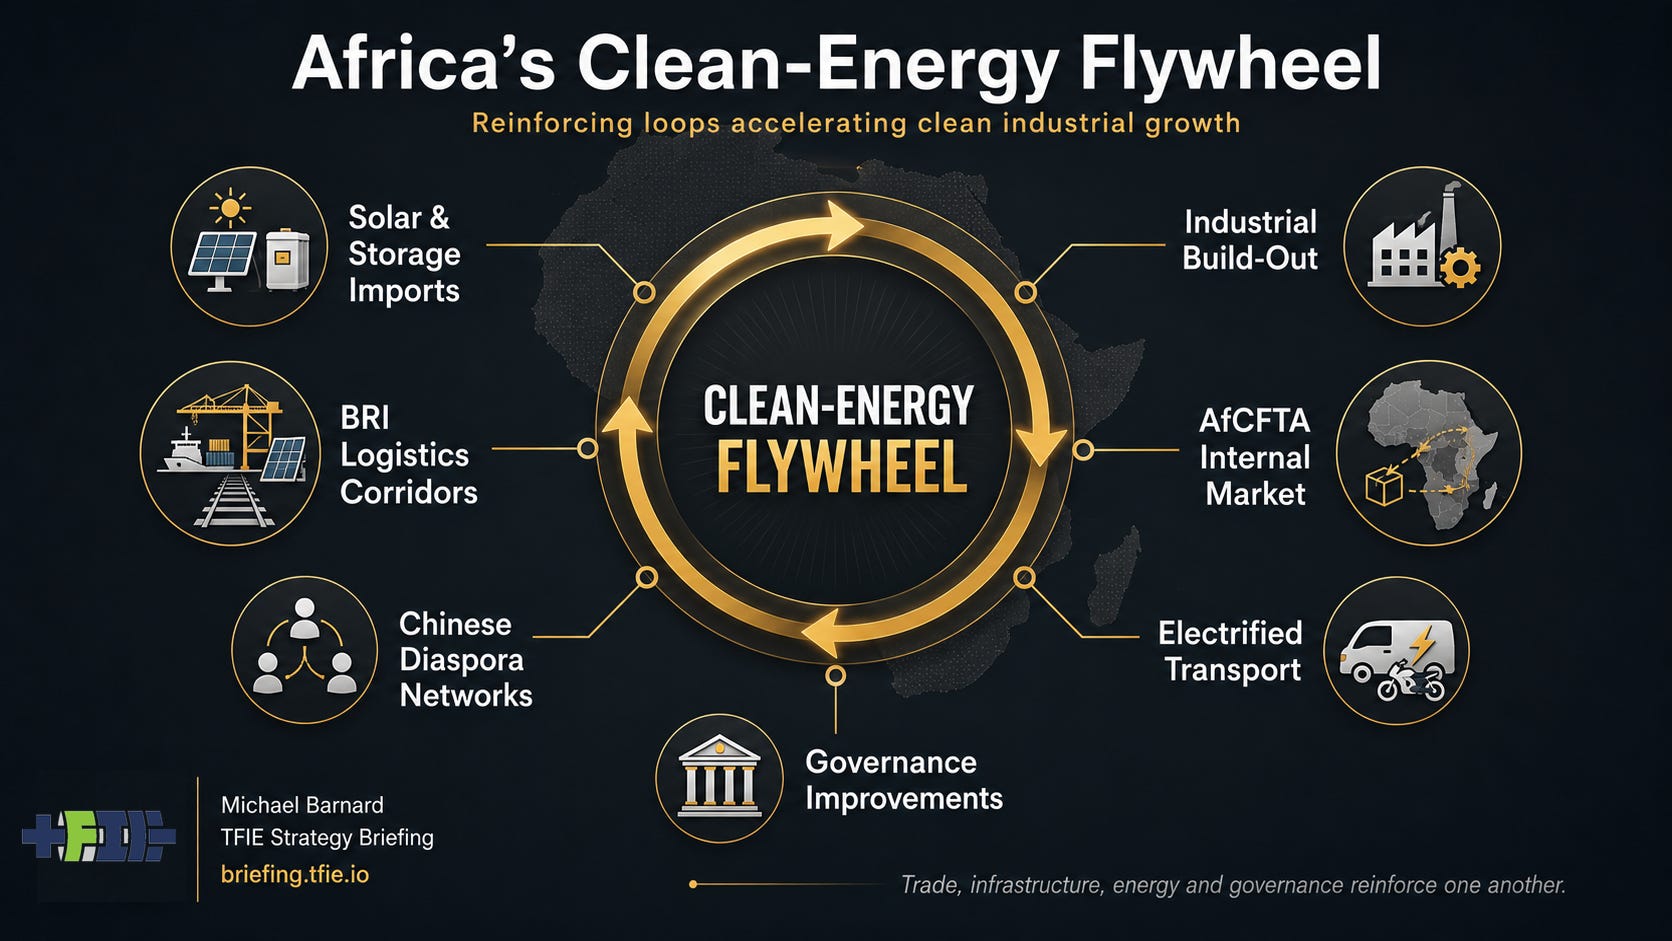
Cheap Chinese solar modules. Falling battery costs. Weak and unreliable grids. Expensive diesel. Mines, telecoms, warehouses, farms and factories with strong incentives to buy reliable electricity directly. The African Continental Free Trade Area slowly making the continent less like 50-plus disconnected markets and more like a plausible trading system. Chinese-built ports, roads, rail and power infrastructure giving containers somewhere to go after they leave a ship. None of these is sufficient on its own. Together, they start to look like a flywheel.
That was the argument in my earlier piece, Crocodile Economics Comes to Africa: Trade, Solar, and the New Energy Map, where I described Africa’s emerging clean-energy flywheel. Solar and storage imports lower the cost of reliable electricity. Better logistics corridors move hardware inland. AfCFTA makes cross-border trade and continental scale more plausible. Chinese diaspora business networks and contractors connect suppliers with buyers. Electrified transport creates new electricity demand and battery-service models. Industrial buildout follows cheaper and more reliable power. Governance improves as markets deepen and predictable rules become more valuable. Each loop reinforces the next.
That flywheel framing matters because the new data does not prove the thesis yet. It does something more useful. It tells us where to look. Africa’s solar boom may not show up first in official installed-capacity tables. It may show up first in customs data, commercial projects, diesel displacement, mini-grids, warehouses and panels that have physically entered African markets before the statistics know how to classify them.
The most recent headline is easy to misread. Recent reporting says Africa added a record 11.3 GW of renewable capacity in 2025, three times the previous year, and that of 322 energy projects announced across the continent, 173 were solar. That is a meaningful renewables number. It is not a solar number. Hydro and wind are doing real work in the broader total, and confusing the renewables headline with the solar denominator leads directly to bad analysis.
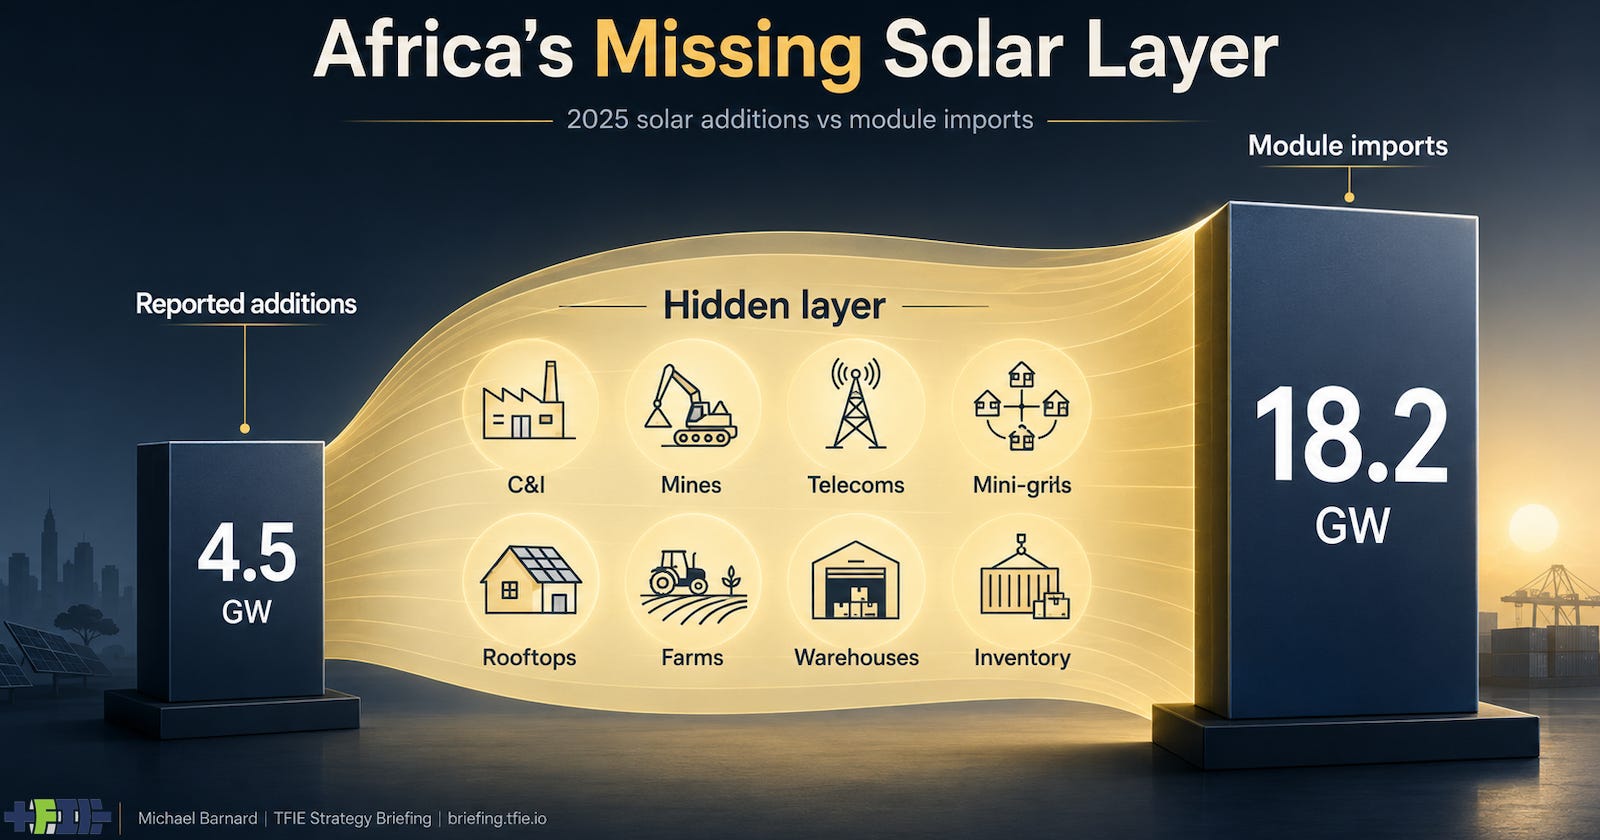
The solar-specific number is smaller and more interesting. The Global Solar Council says Africa installed about 4.5 GW of new solar PV in 2025, up 54% year over year. That is still modest compared with India or Brazil. But the same assessment says Africa imported 18.2 GW of solar modules in 2025. That is the number that changes the interpretation. One year of module imports exceeded the council’s medium-scenario expectation for mainly utility-scale installations across 2026 and 2027 combined.
The gap between 4.5 GW of reported solar additions and 18.2 GW of module imports is not proof that 13.7 GW has been secretly installed. Some of those modules are inventory. Some are headed to projects not yet commissioned. Some may be delayed, re-exported or caught in normal project timing. But the mismatch is too large to dismiss as statistical noise. Solar modules are physical objects. They arrive in containers. They sit in warehouses. They get bolted to roofs, fields, factories, telecom sites, mines and mini-grid systems. They can also disappear from formal utility statistics when they are behind the meter, off-grid, or too fragmented to be captured by national reporting systems.
This is the difference between a visible energy transition and a real one. Visible transitions have auctions, press releases, grid-connection agreements and commissioning ceremonies. Real transitions also have procurement managers cutting diesel bills, mine operators buying reliability, telecom firms reducing fuel logistics, farmers installing pumps, factories hedging outages and households buying panels because the grid is not worth waiting for. The first is easier to count. The second can move faster.
A 20 GW African solar year in 2026 is still a stretch if we mean official reported installations. It would require Africa to go from 4.5 GW in 2025 to about 20 GW in 2026, roughly a 4.4x increase in one year. That kind of acceleration is possible in energy systems, but it usually requires policy, financing, interconnection, procurement and reporting machinery that is already functioning at scale. India has that machinery. Brazil has a different version of it. Africa does not, because Africa is not a single power market.
But a 20 GW year looks different if the metric is physical panel absorption. If 2026 imports remain high, if some 2025 inventory turns into installations, if C&I solar keeps growing, if mining solar-plus-storage reaches commissioning, if Nigeria’s mini-grid and distributed energy programmes keep moving, and if Egypt’s solar-plus-storage projects arrive on schedule, then African markets could absorb a quantity of solar hardware that looks much closer to the prediction than official capacity tables will admit at first.
The pathway is not uniform. Egypt and Morocco are showing the grid-scale solar-plus-storage version. South Africa is showing the private industrial and grid-constrained version. Nigeria is showing the diesel-displacement and mini-grid version. Zambia is showing the hydro-drought hedge version. The DRC is showing the mine-power version. Ghana and Botswana are showing industrial and early utility-scale versions. Chad and the Sahel are showing access and small-base growth. Same technology family. Different economic jobs.
That is why the India comparison is useful, but limited. India installed 36.6 GW of solar in 2025, up nearly 43% from 2024, with large-scale projects doing most of the heavy lifting. That is what formal solar scaling looks like when there is a national procurement machine, a domestic policy architecture, serious grid planning, and enough administrative capacity to convert auctions into installations. India is not a perfect electricity story, but it is a visible, centrally counted solar buildout at very large scale.
Africa is unlikely to look like that in 2026. The continent’s solar buildout is more likely to be fragmented, commercial, Chinese-supplied, distributed, behind-the-meter and statistically difficult. That does not make it less real. It may make it faster in some segments, because customers do not have to wait for a national utility to become competent before reducing diesel use.
Brazil is a better comparison in one respect, because it shows what happens when distributed solar becomes a mass market. Brazil was expected to add roughly 13 GW of solar in 2025, with about 8.5 GW from distributed generation and 4.6 GW from centralized generation under one industry forecast. Brazil’s policy structure is different, especially around distributed generation, but the lesson is relevant: customer-side solar can become the main event, not a decorative footnote to utility-scale projects.
South America also gives us Chile, the storage reference case. Put enough cheap solar into a grid and daytime prices fall, curtailment appears, and storage becomes economically obvious. That is not a failure of solar. It is what happens when a cheap generation technology wins enough market share that the rest of the system has to adapt. In Africa, the early version of that story will not be curtailment everywhere. It will be outage avoidance, diesel displacement and batteries doing jobs that grid operators and fuel trucks used to do badly.
The public story, then, is not that Africa is finally catching up on renewables. The better story is that Africa may be taking a different sequence. The 20th-century model was large centralized generation, expanding grids, growing industrial load and then cleaner electricity later. The emerging African solar model is layered. Utility solar and transmission matter. So do mini-grids, batteries, industrial self-generation, rooftops, telecom sites, mines, cold chains, farms and factories. The continent does not have to choose one path. The evidence suggests it is already taking several.
That is what makes the import data important. Official additions tell us what has been formally connected, reported and recognized. Module imports tell us what the market is physically preparing to use. The 2025 gap between reported additions and imports gives us a testable hypothesis: Africa’s solar transition is larger than the utility-scale statistics, and 2026 will show whether that gap is mostly inventory, pipeline timing, or undercounted deployment.
The import gap is the useful test: Africa’s solar transition is probably larger than utility-scale statistics imply, but the gap still has to be sorted into inventory, project timing, and undercounted deployment. Below the paywall, I check that signal against country-level imports, inverter data, C&I and mining demand, rooftop absorption, grid-connection limits, reported additions, and the 2026 evidence that will show whether the statistics are catching up to reality or the market has over-ordered ahead of deployment.
