


Grid flexibility is usually discussed through whatever is easiest to count. One jurisdiction announces several gigawatt-hours of batteries, another creates a new ancillary-service product, and a third publishes a capacity auction, pumped-hydro plan or demand-response target. Those figures are evidence that institutions, developers and system operators are active, but they are not yet evidence that a power system can identify its reliability needs, enable the right resources, deliver the required portfolio, operate it well and correct the gaps that appear in practice. I built a comparative decision screen covering 25 electricity operating systems to test that harder question across the Australian National Electricity Market, ERCOT, Brazil’s interconnected system, coupled European systems and subnational operating systems including Guangdong, Sichuan, Western Inner Mongolia, Gujarat, Rajasthan, Tamil Nadu, Kyushu and K-Electric’s service territory.
The comparison is purposive and unweighted rather than a census of the world’s grids. Each operating system counts once regardless of electricity demand, generation, installed capacity or population, so the findings describe this 25-system sample rather than estimating the global share of power systems at any particular level of maturity. Even within that boundary, the most important result is not which jurisdiction has the most batteries. The assessed systems are generally better at understanding flexibility than delivering it: planning, market access, network integration and procurement pipelines are widespread, while broad delivered portfolios and demonstrated correction are not. Grid flexibility is therefore primarily an execution problem.
Battery-electric storage remains the leading manufactured technology for fast response and intraday shifting. Costs have fallen, production is scalable, controls are improving and deployment can be much faster than major civil infrastructure. My Grid Storage Through 2100 assessment puts batteries first for manufactured storage and pumped or reservoir hydro as the bulk-duration anchor where geography and existing assets support it, but battery capacity is not a grid-maturity score because different systems solve the same reliability jobs through different combinations of storage, hydro, transmission, demand flexibility, generation and regional trade.
Norway is the cleanest counterexample to a battery-nameplate denominator. Its physical electricity supply in 2024 was 95% renewable, with 83% from hydro, while reservoir management, networks and Nordic market integration provide a mature flexibility architecture without a California-sized battery fleet. Norway also imported 14.7 TWh gross, including 10.9 TWh from Sweden, so the system is not autarkic and should not be assessed as though all flexibility were domestic. California shows the opposite problem: statewide battery capacity rose from 500 MW in 2019 to more than 13,300 MW in 2024, yet CAISO’s March 2025 operating data still recorded 919,020 MWh of wind and solar curtailment, negative prices in 18.13% of five-minute intervals and a 19,959 MW three-hour net-load ramp. Its 2025 summer assessment also counted emergency resources and intertie assistance alongside expected new batteries, showing that battery leadership does not abolish the rest of the flexibility problem.
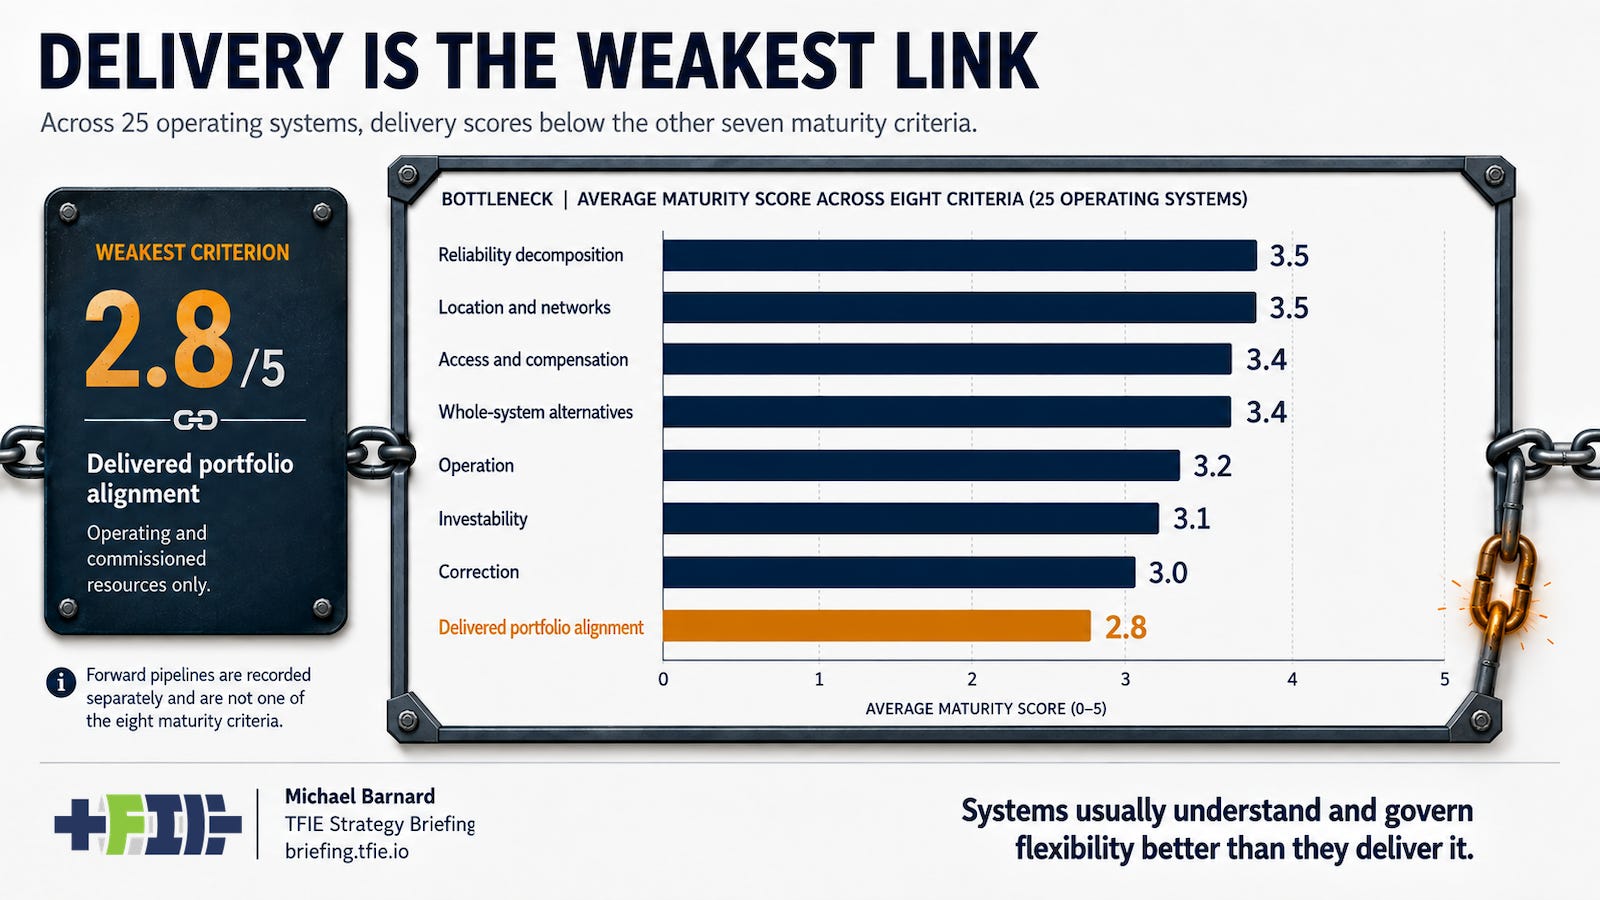
The comparison uses eight anchored criteria. Five test whether the system can decompose reliability needs, compare whole-system alternatives, provide access and compensation, support durable investment, and connect resources where they are useful. One tests whether the delivered operating portfolio aligns with those needs, while two test operational visibility and correction of observed gaps. Forward projects are recorded separately so that tenders, contracts and plans do not inflate delivered maturity. Across the 25 systems, reliability decomposition and locational integration average 3.5 out of 5, market access and alternatives analysis average 3.4, operational visibility averages 3.2, investability falls to 3.1, correction to 3.0 and delivered portfolio alignment to 2.8.
That pattern matters more than small differences among individual systems because it places the institutional front end of the transition ahead of the physical back end. Regulators know that flexibility matters, system operators can describe the problem, markets increasingly allow storage and demand-side resources to participate, governments are running tenders and developers are filling queues. The weak link is converting those mechanisms into operating assets, dependable demand response, usable transfer capability and measured reductions in congestion, curtailment, gas firming or adequacy risk. The sample contains a small leading cluster, a much larger group with capable institutions but incomplete delivery, and several systems whose forward pipelines are substantially stronger than their operating portfolios.
Those are groupings rather than ranks, and the argument is complete without pretending that the evidence supports a league table. The strongest systems combine institutional capability, delivered portfolios and measured correction, while most systems in the sample currently have only one or two of those three. The professional layer below the paywall begins with the three systems that have achieved broad delivered alignment, then places all 25 systems into six non-ranked profiles. It examines why pipelines so often outrun operation, how China and India fragment into different operating systems, which profiles depend on regional support, how sensitive the groupings are to reasonable changes in assumptions, and what evidence would change the assessment.
