

Britain’s National Energy System Operator paid just under £944,000 to flexibility providers during the winter of 2024/25. It also estimated that using its Demand Flexibility Service rather than alternative balancing actions saved electricity consumers £483,000. Accepted tenders were worth approximately £1.23 million, and participating providers had registered almost two million electricity meter points.
Those figures describe a functioning flexibility programme, but they measure different things. The £483,000 is an estimated saving for the electricity system relative to other available options. The £944,000 is money paid to service providers, not their profit. The £1.23 million records accepted tenders, not final payments. The nearly two million registered meter points describe potential participation, not two million customers delivering flexibility on every occasion.
This distinction matters because electricity flexibility is increasingly presented as a large commercial opportunity. Batteries, managed charging, industrial demand response, virtual power plants and other arrangements can reduce electricity-system costs. Whether they generate attractive investment returns depends on which benefits can be converted into payments, who receives those payments, and what it costs to provide the service.
The figures come from the National Energy System Operator’s July 2025 review of the Demand Flexibility Service, or DFS. The programme had evolved from an emergency winter contingency into a competitive balancing tool. During the winter of 2024/25, NESO procured flexibility on 44 occasions, accepting bids totalling 5,449.6 MWh and recording 3,917.7 MWh of delivered response. Households and businesses provided the underlying changes in electricity consumption, while suppliers and aggregators assembled and offered those responses to the system operator.
The estimated £483,000 saving was calculated against NESO’s forecast costs of alternative balancing actions at the time of procurement. It is not a gross benefit from which the £944,000 payment should be deducted again. The comparison already concerns the relative cost of obtaining the required balancing service. Nor is the saving a direct measurement of reductions on individual household bills. It is a modelled system-cost difference under NESO’s assessment methodology.
The payments followed a different accounting path. NESO purchased services from registered providers, which in turn had arrangements with participating customers. Those providers incurred costs to recruit customers, establish controls, forecast response, submit bids, manage performance and settle payments. Customers received whatever compensation their individual programmes offered. The wider electricity system benefited from having another option for balancing supply and demand.
The buyer, beneficiary, payer, provider, asset owner and customer need not be the same organization. A balancing service may benefit consumers collectively while the provider receives a contract payment and individual households receive rewards for changing consumption. Some roles can be combined, but combining them does not eliminate the costs or obligations associated with each.
System value, procurement spending, provider revenue and customer benefit follow different paths.
NESO’s settled payments totalled £943,983, with approximately £76,700 withheld under performance rules. That difference illustrates another boundary between an award and revenue earned. The public figures do not reveal the aggregate profit of participating businesses, how much compensation reached customers, or what providers spent securing and delivering their portfolios. A business valuation built directly from market payments without those costs would be missing much of the business.
The distinction becomes more consequential when flexibility is used to postpone investment in physical electricity networks rather than replace a more expensive balancing action. The potential benefit can be substantial, but it is measured against an infrastructure alternative and over a different period.
In April 2025, Frontier Economics published a Distribution System Operator Benefits Assessment for SP Energy Networks. Among other activities, it examined locations where SP Energy Networks had contracted flexibility for the first time during 2024/25 to defer network reinforcement. The assessment considered what the network might otherwise have spent on physical infrastructure, the cost of purchasing flexibility, and the timing of expenditure under the alternatives.
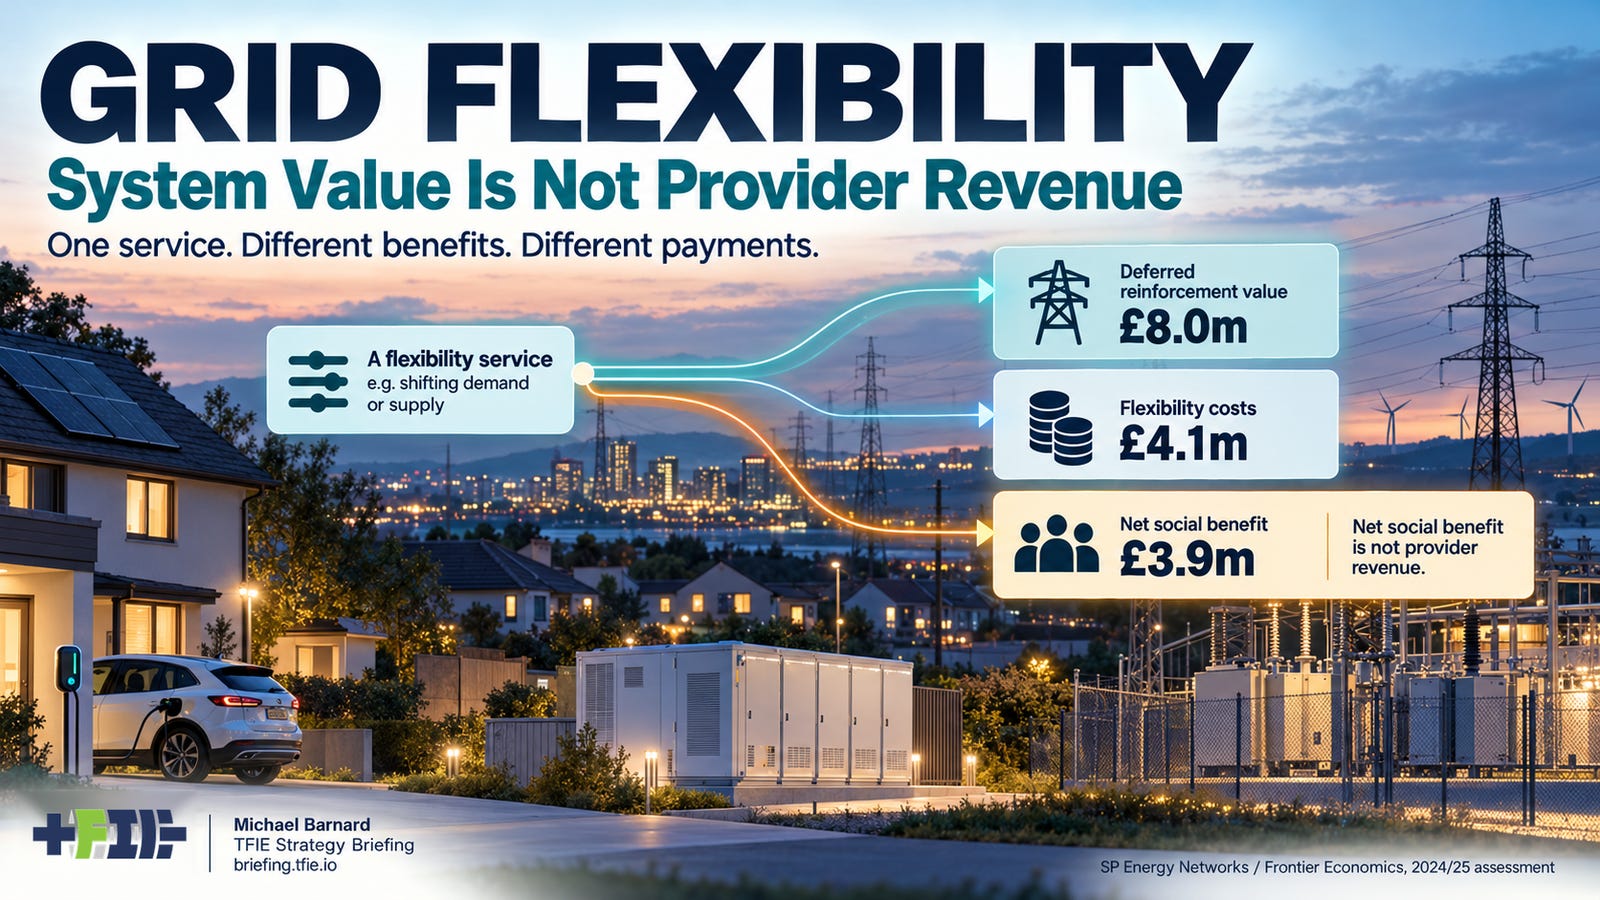
For those newly contracted deferral locations, Frontier estimated approximately £8 million in the long-term present value of deferred reinforcement. Delivering the flexibility services was not free. Modelled long-term flexibility costs were £4.1 million, leaving an estimated £3.9 million in net present social benefits. These are discounted values over the assessment’s long-term horizon, extending to 2083, expressed in 2024/25 prices. They are not cash savings recorded during one financial year.
£8 million of deferred reinforcement value is an appealing headline. It is also a poor estimate of what a flexibility provider could earn. It represents the modelled value of changing infrastructure expenditure under the assessed counterfactual. The operator still needs a reliable service, must pay to obtain it, and may eventually have to construct the infrastructure that has been deferred. The net benefit depends on the difference between compliant alternatives, including their costs, timing and risks.
Deferring a transformer replacement by a year is not equivalent to avoiding the transformer forever. The expenditure may still occur, but later payment has financial value, and additional time may provide better information about demand growth, customer behaviour and the suitability of other solutions. If the anticipated load growth does not materialize, reinforcement may be reduced or avoided. If demand grows faster than expected, the flexibility arrangement may prove inadequate and the upgrade may be needed sooner.
Frontier’s modelling captures aspects of these timing relationships, but it remains an assessment rather than a guarantee. The study relies partly on extrapolation because the final months of 2024/25 were not available when it was prepared. It also identifies limitations concerning non-delivery and greater-than-forecast demand growth. Those uncertainties matter because a relatively small expected saving can disappear if response is unavailable when a transformer is overloaded or an infrastructure project becomes more expensive through delay.
The £3.9 million net present benefit is likewise not money available for distribution to providers. Frontier expresses the modelled benefit as approximately £0.84 per network customer over its evaluation horizon, rather than an annual saving on each customer’s electricity bill. Whether consumers receive the anticipated benefit depends on the regulatory treatment of efficient network expenditure and the costs ultimately recovered through network charges.
For an investor, the commercial question lies further down the chain. A network operator might have a good reason to procure several megawatts of flexible demand at a particular location during constrained hours. Existing commercial or industrial loads may be able to provide that service with limited new capital expenditure. A dedicated battery built for the same requirement has to recover its equipment, connection, financing and operating costs over the life of the asset.
If the need is seasonal, rare or expected to disappear after reinforcement, the difference can determine which solution is economically attractive. A battery may have other revenue opportunities, but those require separate contracts, suitable market access and compatible operating commitments. The utility’s avoided cost helps establish how much the service is worth to the buyer. It does not establish what a new asset will earn.
Retail electricity tariffs offer a third arrangement, one that can benefit customers without creating a separately procured flexibility service. Consider a household that moves 10 kWh of EV charging from an evening period priced at 30 pence per kWh to an overnight period priced at 10 pence. Assuming those are the applicable all-in retail rates and the full 10 kWh can be shifted, the household saves £2 while obtaining the same energy for its vehicle.
That £2 is a customer bill saving under an illustrative tariff. It does not create another £2 of wholesale-market revenue for the retailer or £2 of avoided distribution investment that an aggregator can independently collect. The retailer’s financial result depends on its wholesale purchasing costs, hedging, tariff structure and other charges. The network’s result depends on whether charging moves away from the hours when its equipment is constrained.
The last point can be overlooked when tariffs encourage large numbers of customers to respond in the same way. Shifting EV charging into the night may reduce the system’s evening peak while concentrating demand on a particular distribution feeder after a cheap-rate period begins. One operating objective has improved, but the local network may face a new constraint. Retail prices, distribution operating limits and customer requirements have to be coordinated rather than treated as interchangeable signals.
A retailer or charging aggregator can still build a useful business around automated load shifting. Customers may value a lower bill and the convenience of having charging managed within their departure requirements. The retailer may reduce wholesale exposure or improve customer retention. The aggregator may be paid for providing the service. None of that requires every participant to receive a separately calculated share of the entire electricity-system benefit.
For investors considering aggregated flexibility or batteries, the next complication is that assets can contribute to several services. A battery might shift electricity between wholesale-price periods, provide frequency response, support a constrained distribution network and reserve some capacity for resilience. Compatible services can improve its economics, but the asset has one inverter, one energy inventory and several obligations competing for its availability.
A battery committed to maintaining local network headroom during a winter evening cannot make the same capacity available unconditionally to another buyer during those hours. A refrigerated warehouse cannot promise both daily load shifting and emergency interruption without accounting for temperature limits and recovery. A vehicle cannot commit its entire battery to grid export while preserving an unspecified amount of energy for its owner’s next journey.
These conflicts are manageable through contracts, control systems, operating priorities and appropriate derating. They also mean that adding the maximum potential revenue from every service produces an unreliable business case. The important quantity is the revenue available from a compatible schedule of commitments, adjusted for availability, delivery performance and operating costs.
Payment for availability and payment for activation illustrate the distinction. A network operator may pay a resource to remain ready during specified periods, then make an additional payment when it is instructed to respond. The first buys a qualified commitment; the second buys measured action. An available resource that is not called has not failed its readiness obligation. A resource that responds inadequately when called may face a different commercial consequence.
The distinction changes investment risk. A contract offering availability payments can provide some predictable revenue while imposing costs and reserving capacity for the buyer. An activation-only arrangement may offer a high payment per MWh but provide little annual revenue when events are infrequent. Customer compensation, software, telemetry, metering, settlement, equipment degradation, financing and performance penalties must all be included before a developer can estimate the margin.
Market design can improve the prospects for useful flexibility without guaranteeing profitable providers. Britain’s DFS continued evolving in 2026, introducing bidirectional flexibility, more granular zonal procurement, a lower 0.1 MW participation threshold, revised baseline arrangements and coordination rules. From October, the service also incorporated constraint-management actions that had previously been procured separately. These changes aim to make participation and procurement more closely aligned with specific operating requirements.
Such reforms can lower barriers and create opportunities for more resources to participate. They may also increase competition, reducing the price paid for an increasingly well-supplied service. Lower procurement costs are potentially good for consumers and the operator, but can weaken the revenue assumptions of projects financed when fewer providers were eligible. A larger technically accessible market does not necessarily create a larger profit pool for each participant.
The commercial architecture developed in The Flexibility Mesh follows these distinctions. It begins with a defined physical service, then identifies the buyer, beneficiary, payer, asset owner, provider, network permission and settlement arrangements. The interactive version includes a “Who benefits, who pays?” exploration because the organizations receiving system benefits are not necessarily those making payments or receiving revenue. It is a framework for examining those relationships, not a financial model for an individual project.
For regulators and utilities, the first question is whether an arrangement delivers the required service at lower total cost and acceptable risk than the alternatives. They must also establish who ultimately bears the expenditure and receives the benefit. Customers need a proposition that compensates them adequately for any loss of convenience, control or operating flexibility. Providers need sufficient income after fulfilling those customer and system obligations, while investors need evidence that those margins can persist as competition and market rules change.
Britain’s two programmes illustrate different parts of the same financial problem. NESO’s DFS demonstrates actual procurement and settlement alongside an estimated saving from avoiding more expensive balancing actions. SP Energy Networks’ assessment shows how deferred infrastructure expenditure becomes a smaller net social benefit after the costs and timing of flexibility are considered. Neither makes the full system benefit available as revenue to an individual provider.
The useful financial analysis begins with the service being purchased and the compliant alternative. It then follows the payments through the relevant contracts and organizations, deducts the costs of reliable delivery, and tests whether the remaining value can support the business. That is the difference between a promising contribution to the electricity system and an investable commercial proposition.
The next article in this series will examine the physical and operational counterpart to that financial question: why a large technical flexibility potential becomes a much smaller population of connected, controllable, qualified, permitted and repeatably deliverable resources. That smaller population is the one that can compete for real payments.
This is the second article in a series exploring the implications of The Flexibility Mesh, an open 99-page TFIE Strategy report with an interactive companion. TFIE Strategy provides independent assessment of electricity-system strategy, procurement and investment assumptions. For discussion of a specific flexibility programme or investment thesis, contact michael@tfie.io.