

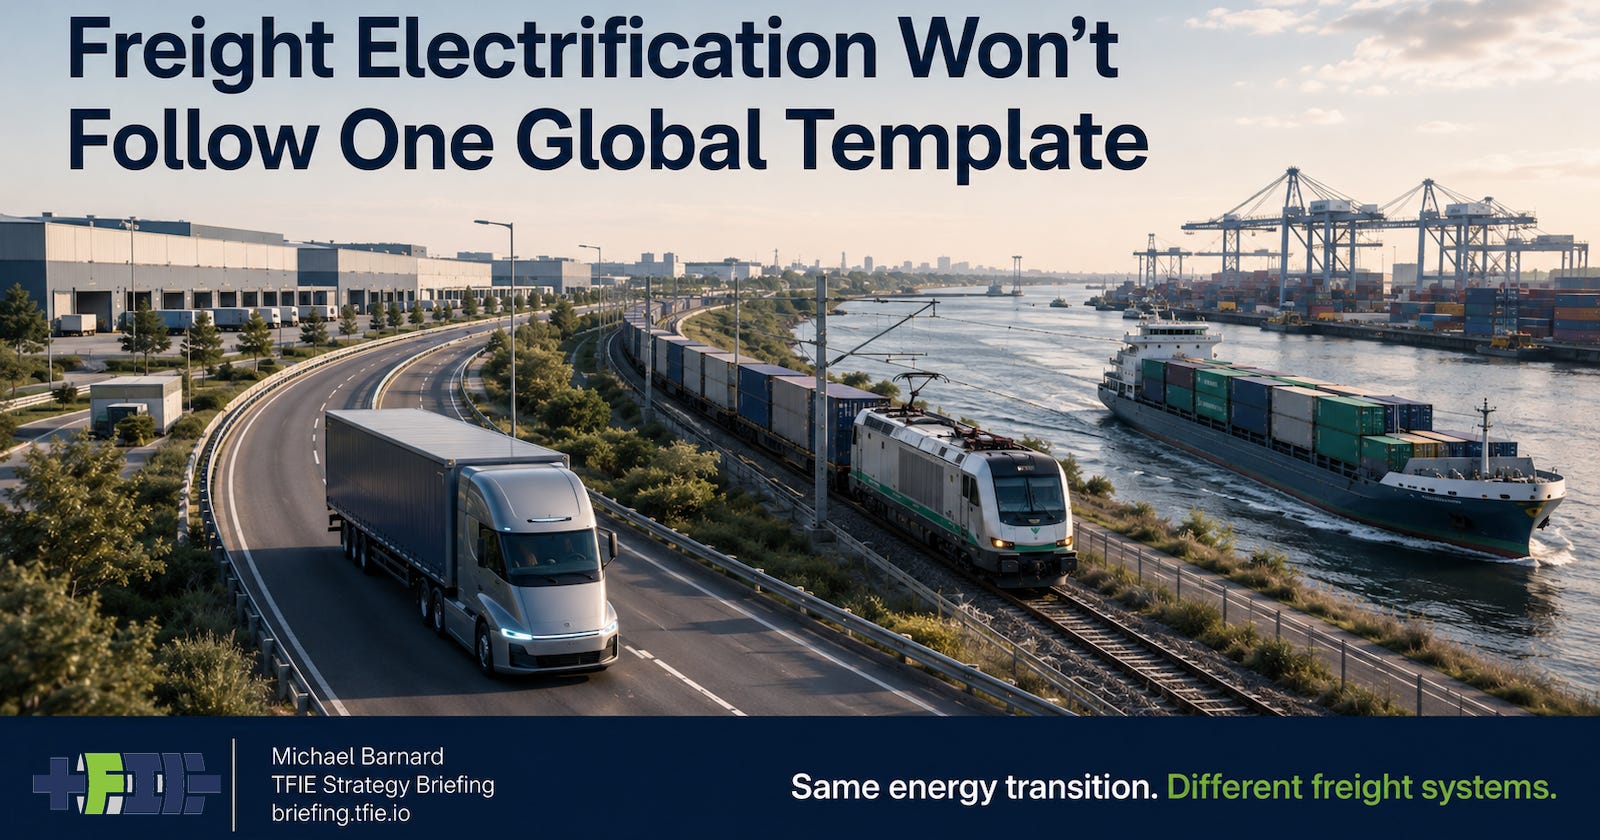
A couple of years ago I looked at the very different economics of decarbonizing domestic freight in China, Europe, India and the United States. The premise was straightforward. Freight does not move the same way everywhere. Some economies have extensive and heavily used rail systems, some have enormous highway networks, some make much greater use of rivers and coastal shipping, and some combine all three at scale. Electrification was going to arrive in those inherited systems rather than replacing them with a globally standardized freight model.
Returning to that analysis with substantially more research behind it produced better numbers. Some of the earlier estimates mixed scopes or leaned too heavily on incomplete data, especially for India and for the treatment of domestic coastal shipping. The dataset below is the one I would use today. More importantly, the improved data reinforce the underlying point: the economics of freight electrification depend heavily on the transport system a geography already has.
The first problem in making the comparison is deciding what counts as domestic freight. Road and rail are relatively straightforward. Water is not. China has large inland-waterway traffic, large coastal domestic shipping volumes and still larger ocean trade. For a comparison of domestic freight, the first two belong in the denominator and international ocean freight does not. Similarly, if the EU-27 is being treated as a single economic geography, freight shipped from Spain to the Netherlands or Finland to Germany is internal water freight in much the same sense that cargo moving between Chinese provinces along the coast is internal to China.
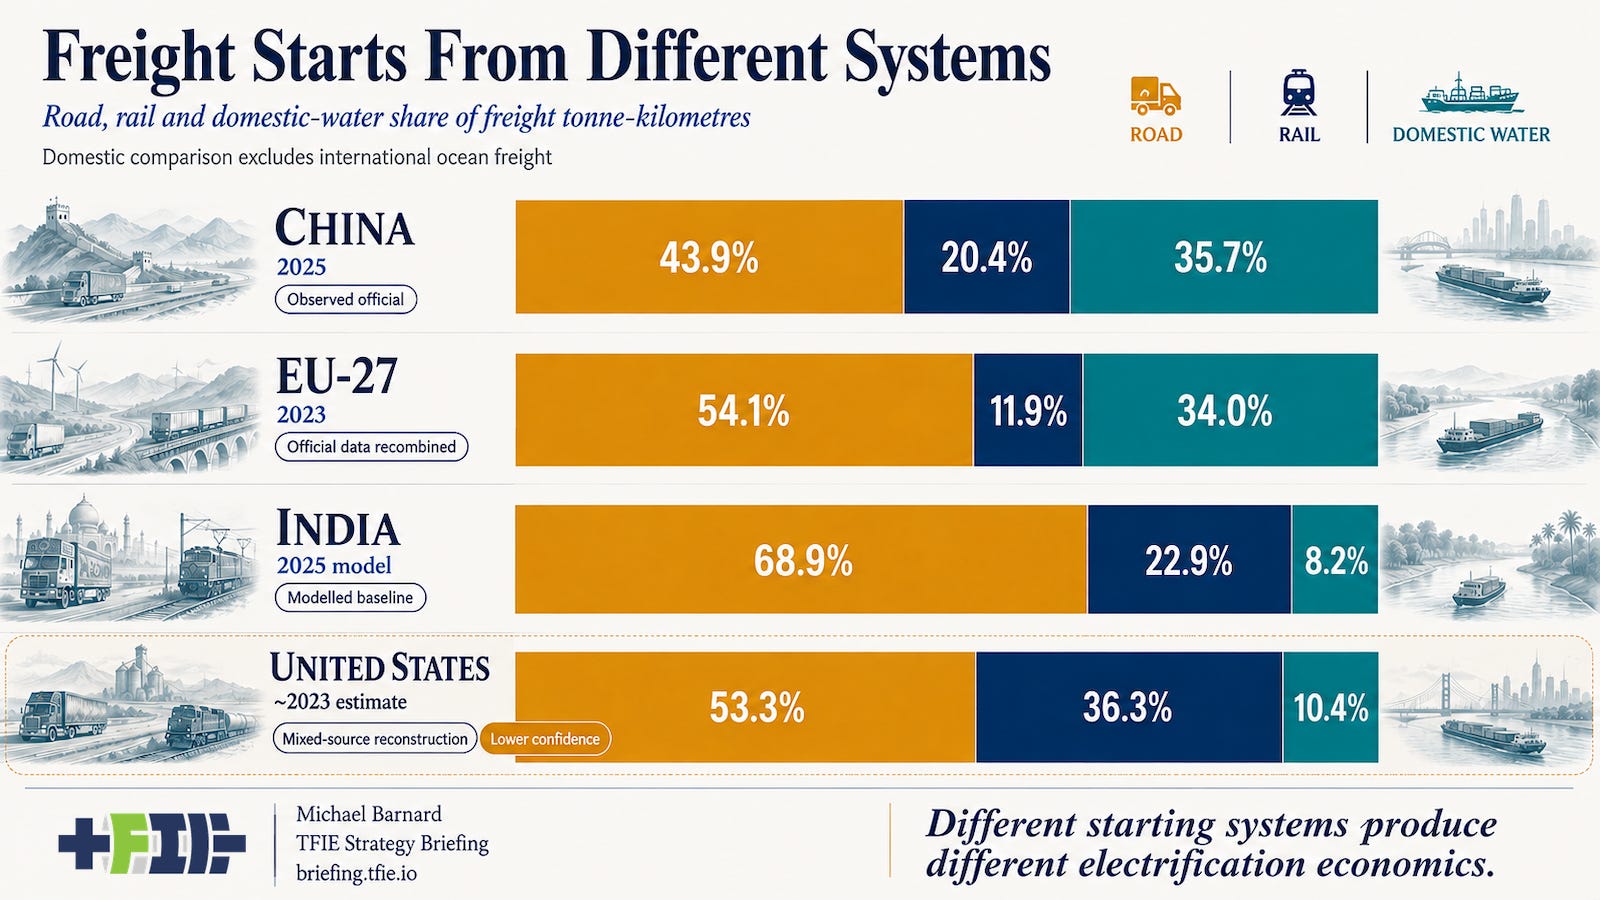
With those boundaries made explicit, China’s 2025 freight statistics work out to about 44% road, 20% rail and 36% domestic water across those three modes. For the EU-27, recombining European Environment Agency 2023 data gives roughly 54% road, 12% rail and 34% internal water freight, although the underlying mode statistics are not perfectly harmonized and should not be presented as though the EEA had published that exact modal split.
India is much more road-heavy. The NITI Aayog modelling baseline, which is a model rather than consolidated measured freight statistics, gives about 69% road, 23% rail and 8% water when its road, rail and water categories are normalized against one another. The United States has a less cleanly harmonized source stack, but the resulting reconstruction is much stronger than the estimate I used previously. It puts the U.S. at roughly 53% road, 36% rail and 10% water across the same three-mode comparison, with somewhat lower confidence than the other rows. The important structural feature is the unusually large role freight rail retains compared with Europe and India.
Those differences are not trivia. They determine where electricity has to enter the freight system. China can electrify enormous truck fleets while still moving very large volumes by rail and water. India has a road-dominant freight economy but is simultaneously building capacity into an almost completely electrified railway. Europe already possesses an extensive railway and waterway system, yet trucks still do most inland freight work. The United States combines a continent-scale road network with a freight railway system that remains commercially important and overwhelmingly diesel powered.
The direction of travel is different as well. China reported about 140,000 new-energy heavy-truck sales in the first half of 2026, up 78.6% year on year. “New energy” is a broader Chinese regulatory category than battery electric, so it would be wrong to label all of those trucks BEVs, but the scale is already industrial rather than experimental. China is also explicitly targeting new-energy heavy trucks at around 40% of annual heavy-truck sales by 2030, while building charging and swapping infrastructure along major freight corridors.
India is pushing in another direction at the same time. Almost all of its broad-gauge railway is now electrified, and around 2,800 kilometers of Dedicated Freight Corridors have been completed. By early 2026 those corridors were handling roughly 480 freight trains a day, according to India’s Ministry of Railways. India has plenty of trucks to electrify, but it also has a credible route for increasing freight movement on infrastructure that already draws electricity directly from the grid.
Europe presents almost the inverse policy problem. It already has more than 200,000 kilometers of rail and a substantial electrified share, yet the long-term inland modal direction has not been toward rail. On Eurostat’s territorial freight series, road gained about 3.3 percentage points of share from 2014 to 2024 while rail and inland waterways slipped slightly. Meanwhile, electrically chargeable trucks above 3.5 tons reached 4.2% of EU registrations in 2025, almost twice their 2024 share but still a small part of the market. Europe cannot wait for modal shift to make road freight disappear. It has to electrify the trucks too.
The United States is the longer-duration case. Its freight railways are good at moving enormous volumes long distances with relatively little energy, while trucks provide flexibility, direct service and speed that rail frequently cannot match. As battery costs and charging infrastructure improve, that competitive boundary moves. National Renewable Energy Laboratory modelling finds zero-emission trucks capable of total-cost-of-driving parity or better across market segments by 2035 under continued technology improvements. That is a 2030s economic signal, not a prediction that rail traffic should already be falling today.
This is consistent with my earlier CleanTechnica analysis of electric trucks versus North American freight rail, which found that electric trucks were already lower-carbon per ton-mile than diesel rail in eight U.S. states and argued that falling battery, energy and maintenance costs would progressively shift the road-versus-rail economics. The point was not that rail would suddenly lose its role, but that a competitive assumption which had been stable for decades was starting to move.
The common direction is electrification, but there is no common modal endpoint. Countries are electrifying the freight systems they actually have, while expanding, shrinking or competing between modes where local economics permit it.
Below the paywall I go from the public comparison to the professional layer: how inherited road, rail and water systems change the economics of electrification, why battery swapping is becoming freight infrastructure for Chinese trucks and commercial vessels while rail is only beginning to test the same modular-energy idea, and where that leaves infrastructure and capital decisions through the 2030s.
