

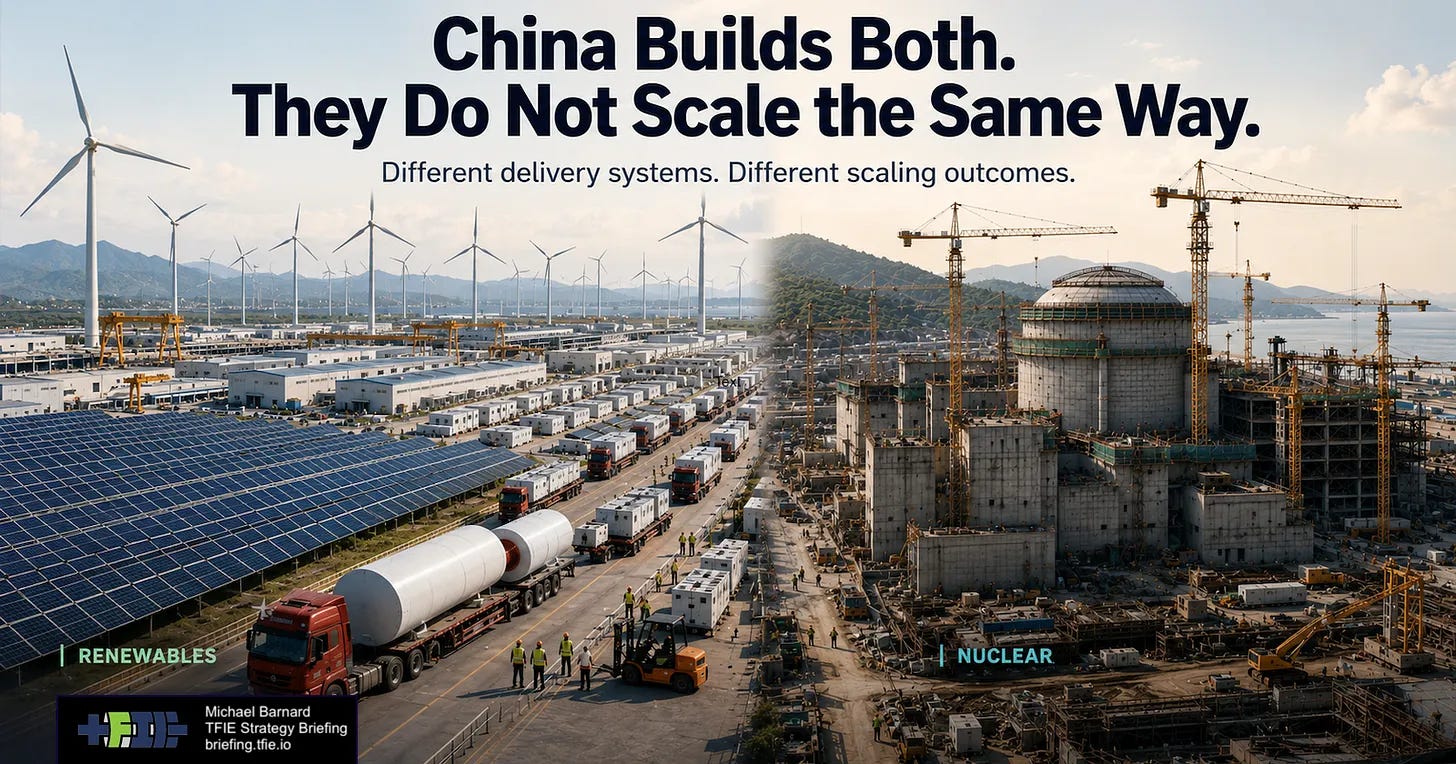
China provides the electricity sector’s strongest natural experiment in nuclear power versus renewable scalability. Rising demand, deep industrial supply chains, abundant state-directed capital, centralized planning and experienced engineering organizations are available to both pathways. The usual explanations for slow nuclear deployment elsewhere, including weak political support, fragmented permitting, shallow supply chains and difficulty financing large projects, have much less explanatory power in China.
Yet the same state keeps getting opposite results from the targets it sets. Wind and solar targets are overtaken early, often by years. Nuclear operating-capacity targets are approached slowly and missed. That is not because Beijing has secretly lost interest in nuclear power. China has the world’s largest reactor construction programme and continues approving new units. The difference lies in what happens between a plan and an operating asset.
For wind and solar, the delivery system is an industry. Factories manufacture repeated components, developers assemble many projects in parallel, installation crews move from site to site, and each year’s output provides feedback before the next year’s equipment leaves the factory. A weak developer, delayed substation or unsuitable site does not stop the national programme. The system can lose individual projects and still increase annual throughput.
For nuclear, the delivery system remains a relatively small number of very large projects. Each reactor passes through site preparation, civil works, nuclear-island construction, equipment installation, testing, fuel loading, grid connection and commercial operation. The supply chain may be national, but the completion path is concentrated. Delays in a design family, a safety review, an approval cycle or a critical component can affect a significant share of the programme at once.
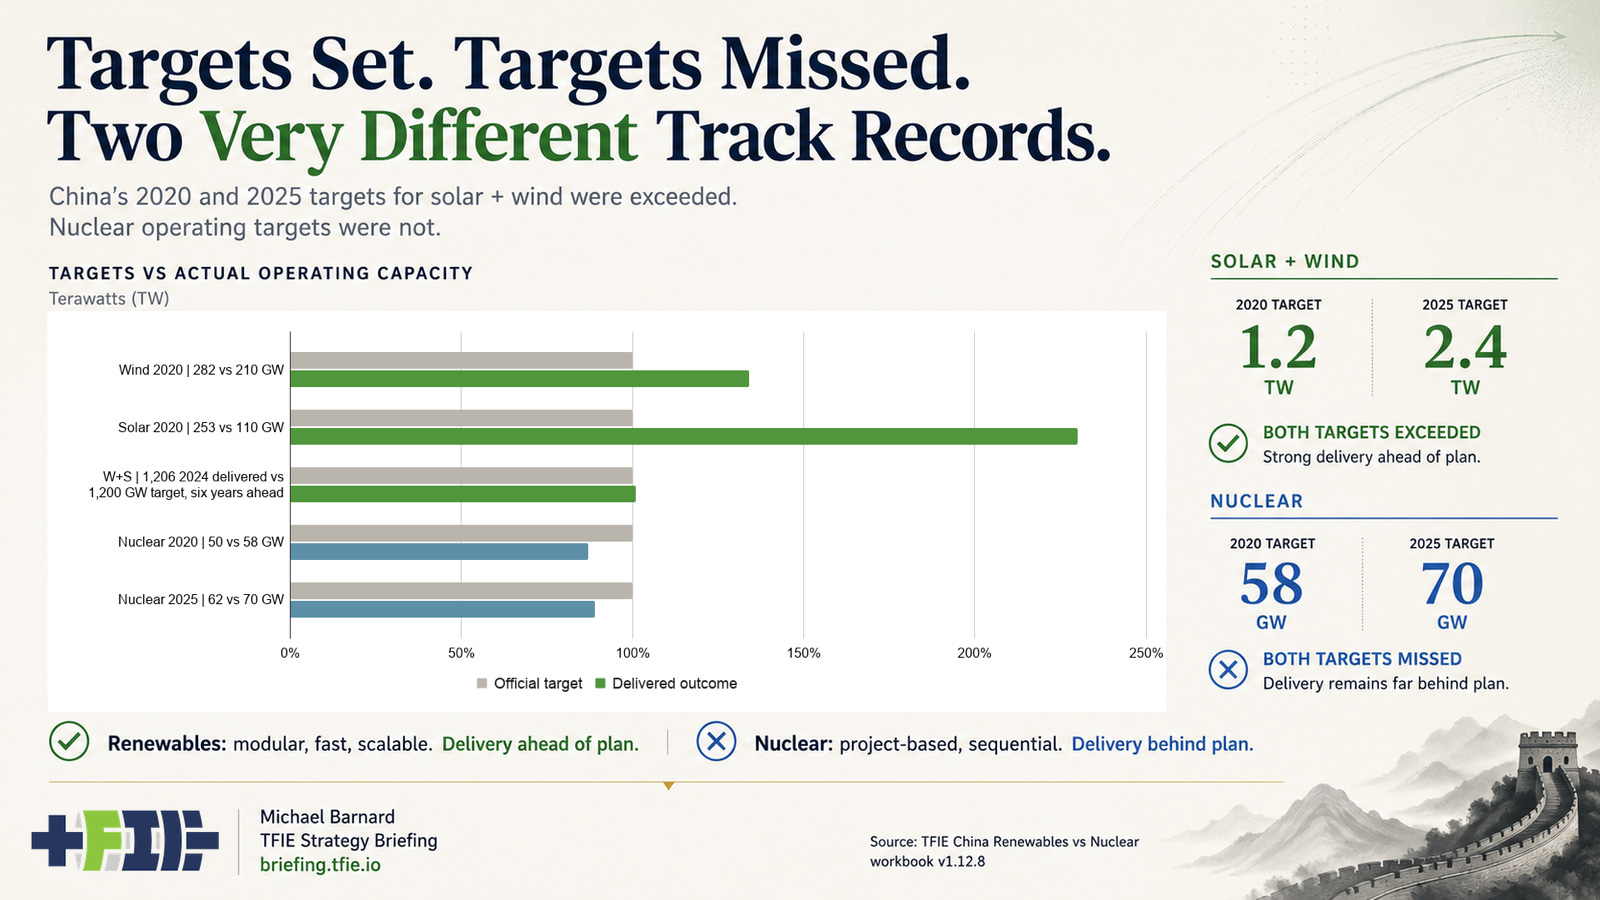
The target history makes the distinction hard to avoid. China’s 2020 wind target was 210 GW and the country finished the year with roughly 282 GW. Its solar target was 110 GW and delivery was about 253 GW. The later commitment to reach at least 1,200 GW of combined wind and solar by 2030 was crossed in 2024, six years early. By the end of 2025, the official statistical series used in my workbook put wind at 640 GW and solar at 1,202 GW, for a combined 1,842 GW.
Nuclear moved in the other direction. The 2020 operating target was 58 GW and delivery was about 50 GW. The 2025 target was 70 GW and the operating fleet reached about 62 GW. The current 110 GW target for 2030 may still be reached, but it should be treated as a target rather than silently converted into a forecast. Doing that would repeat the forecasting error already visible in the 2020 and 2025 record.
Targets are only one test. The more revealing question is whether the annual delivery record shows a repeatable production system. Installed capacity can obscure that mechanism because it accumulates assets built over decades. A more direct comparison converts each year’s newly added capacity into the mature full-year electricity it could produce once operating normally.
For this comparison, I use mature-new-build capacity factors of 27% for wind, 15% for solar and 90% for nuclear. Because PRIS reports nuclear capacity on a net basis while China’s reported generation series is gross, I multiply the nuclear result by a 1.064 gross-to-net factor derived from China’s 2025 nuclear generation and electricity-supplied data. The comparison is therefore expressed on a common gross-equivalent basis in TWh per year, rather than raw GW.
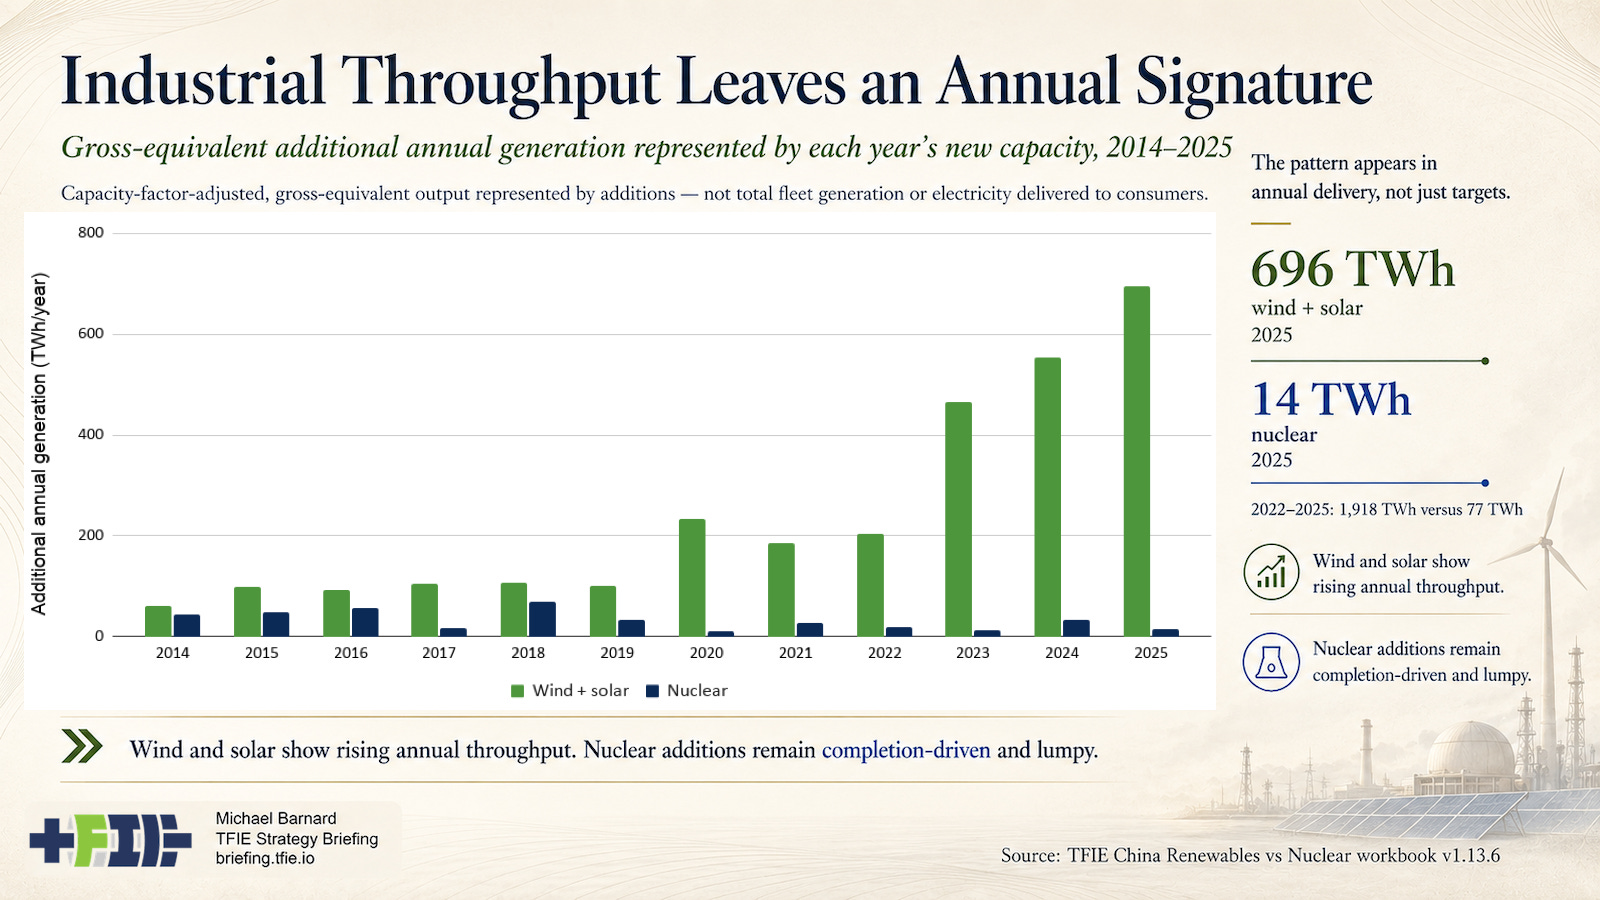
In 2025, new wind capacity represented about 282 TWh per year of mature annual generation and new solar capacity about 414 TWh per year. New nuclear capacity represented about 14 TWh per year on the same gross-equivalent basis. The combined wind-and-solar addition was therefore about 50 times the mature annual generation represented by the year’s new nuclear capacity.
One exceptional year should not carry the entire argument. Across 2022–2025, the same conversion gives wind and solar additions about 1,918 TWh per year of cumulative represented output, compared with about 77 TWh per year for nuclear. That is roughly 25 times as much additional annual generation across the cleaner four-year comparison period.
The ratio should not be mistaken for a claim that variable electricity has the same system value as firm nuclear generation in every hour. Nor does it compare total fleet generation. It measures the gross-equivalent annual electricity represented by each year’s newly added assets after accounting for their different mature capacity factors and converting PRIS nuclear capacity from its reported net basis to the same gross basis.
The pre-2022 bars are mixed-source historical context rather than one uniform official series, so I do not use them for precise ratio claims. The cleaner 2022–2025 period still shows wind and solar additions behaving like a growing industrial production system, while nuclear additions remain completion-driven, small and irregular. The distinction is not that nuclear projects never complete. It is that their annual completion rate remains narrow and lumpy relative to the manufacturing and installation throughput of the modular alternatives.
The denominator matters. Nuclear approvals are not operating reactors, just as a solar manufacturing announcement is not a grid-connected array. China’s nuclear approvals have accelerated, but approval is several delivery stages removed from commercial operation. The most defensible committed-project nuclear case is built from individually named reactors under construction, their observed progress and the probability that commissioning dates move. A fuller expected-value forecast must also estimate future construction starts.
The historical evidence establishes that China’s renewable and nuclear programmes scale differently. It does not by itself tell us how much wind and solar the grid can absorb by 2035, how much of the current reactor inventory will reach operation, or what assumptions are required to turn approvals into a credible nuclear forecast. Below the paywall, I build those pathways separately, publish the supporting workbook and identify the evidence that would move each case.
